Prototype URL: https://www.figma.com/proto/ZWpeGTSfSnE4PB9mQnFppCXB/
Project Description
The chip card customers are tagged as delinquent when they hit the final payment date and go through it without making the payment. The number of the delinquency cycle (ranging from one to seven) explains how many months the customer did not pay their bill. It takes a total of seven billing cycles (7*30days=210 days) before the bank charges off an account. The purpose of the dashboard is to provide knowledge of the drop (the money bank recovers from customers) against the original balance.
What could possibly happen when customers become delinquent?
What did users have to say about their daily duties and pain points?
I conducted four user interviews to gain insights into their experience with the existing dashboard
Open File Drop Dashboard User insight
I gathered insights from the meetings and documented them on sticky notes
I created an affinity diagram to organize user insights and feedback into groups based on similarities, enabling me to identify patterns and key takeaways through clustered ideas and a clear visual representation.
Existing Drop Dashboard
Persona: Open File Drop
I created a user persona based on insights and affinity mapping, developing three fictional characters that represent key user groups, their common tasks, pain points, goals, and behaviors. This approach helps me better understand and address user needs throughout the design process.
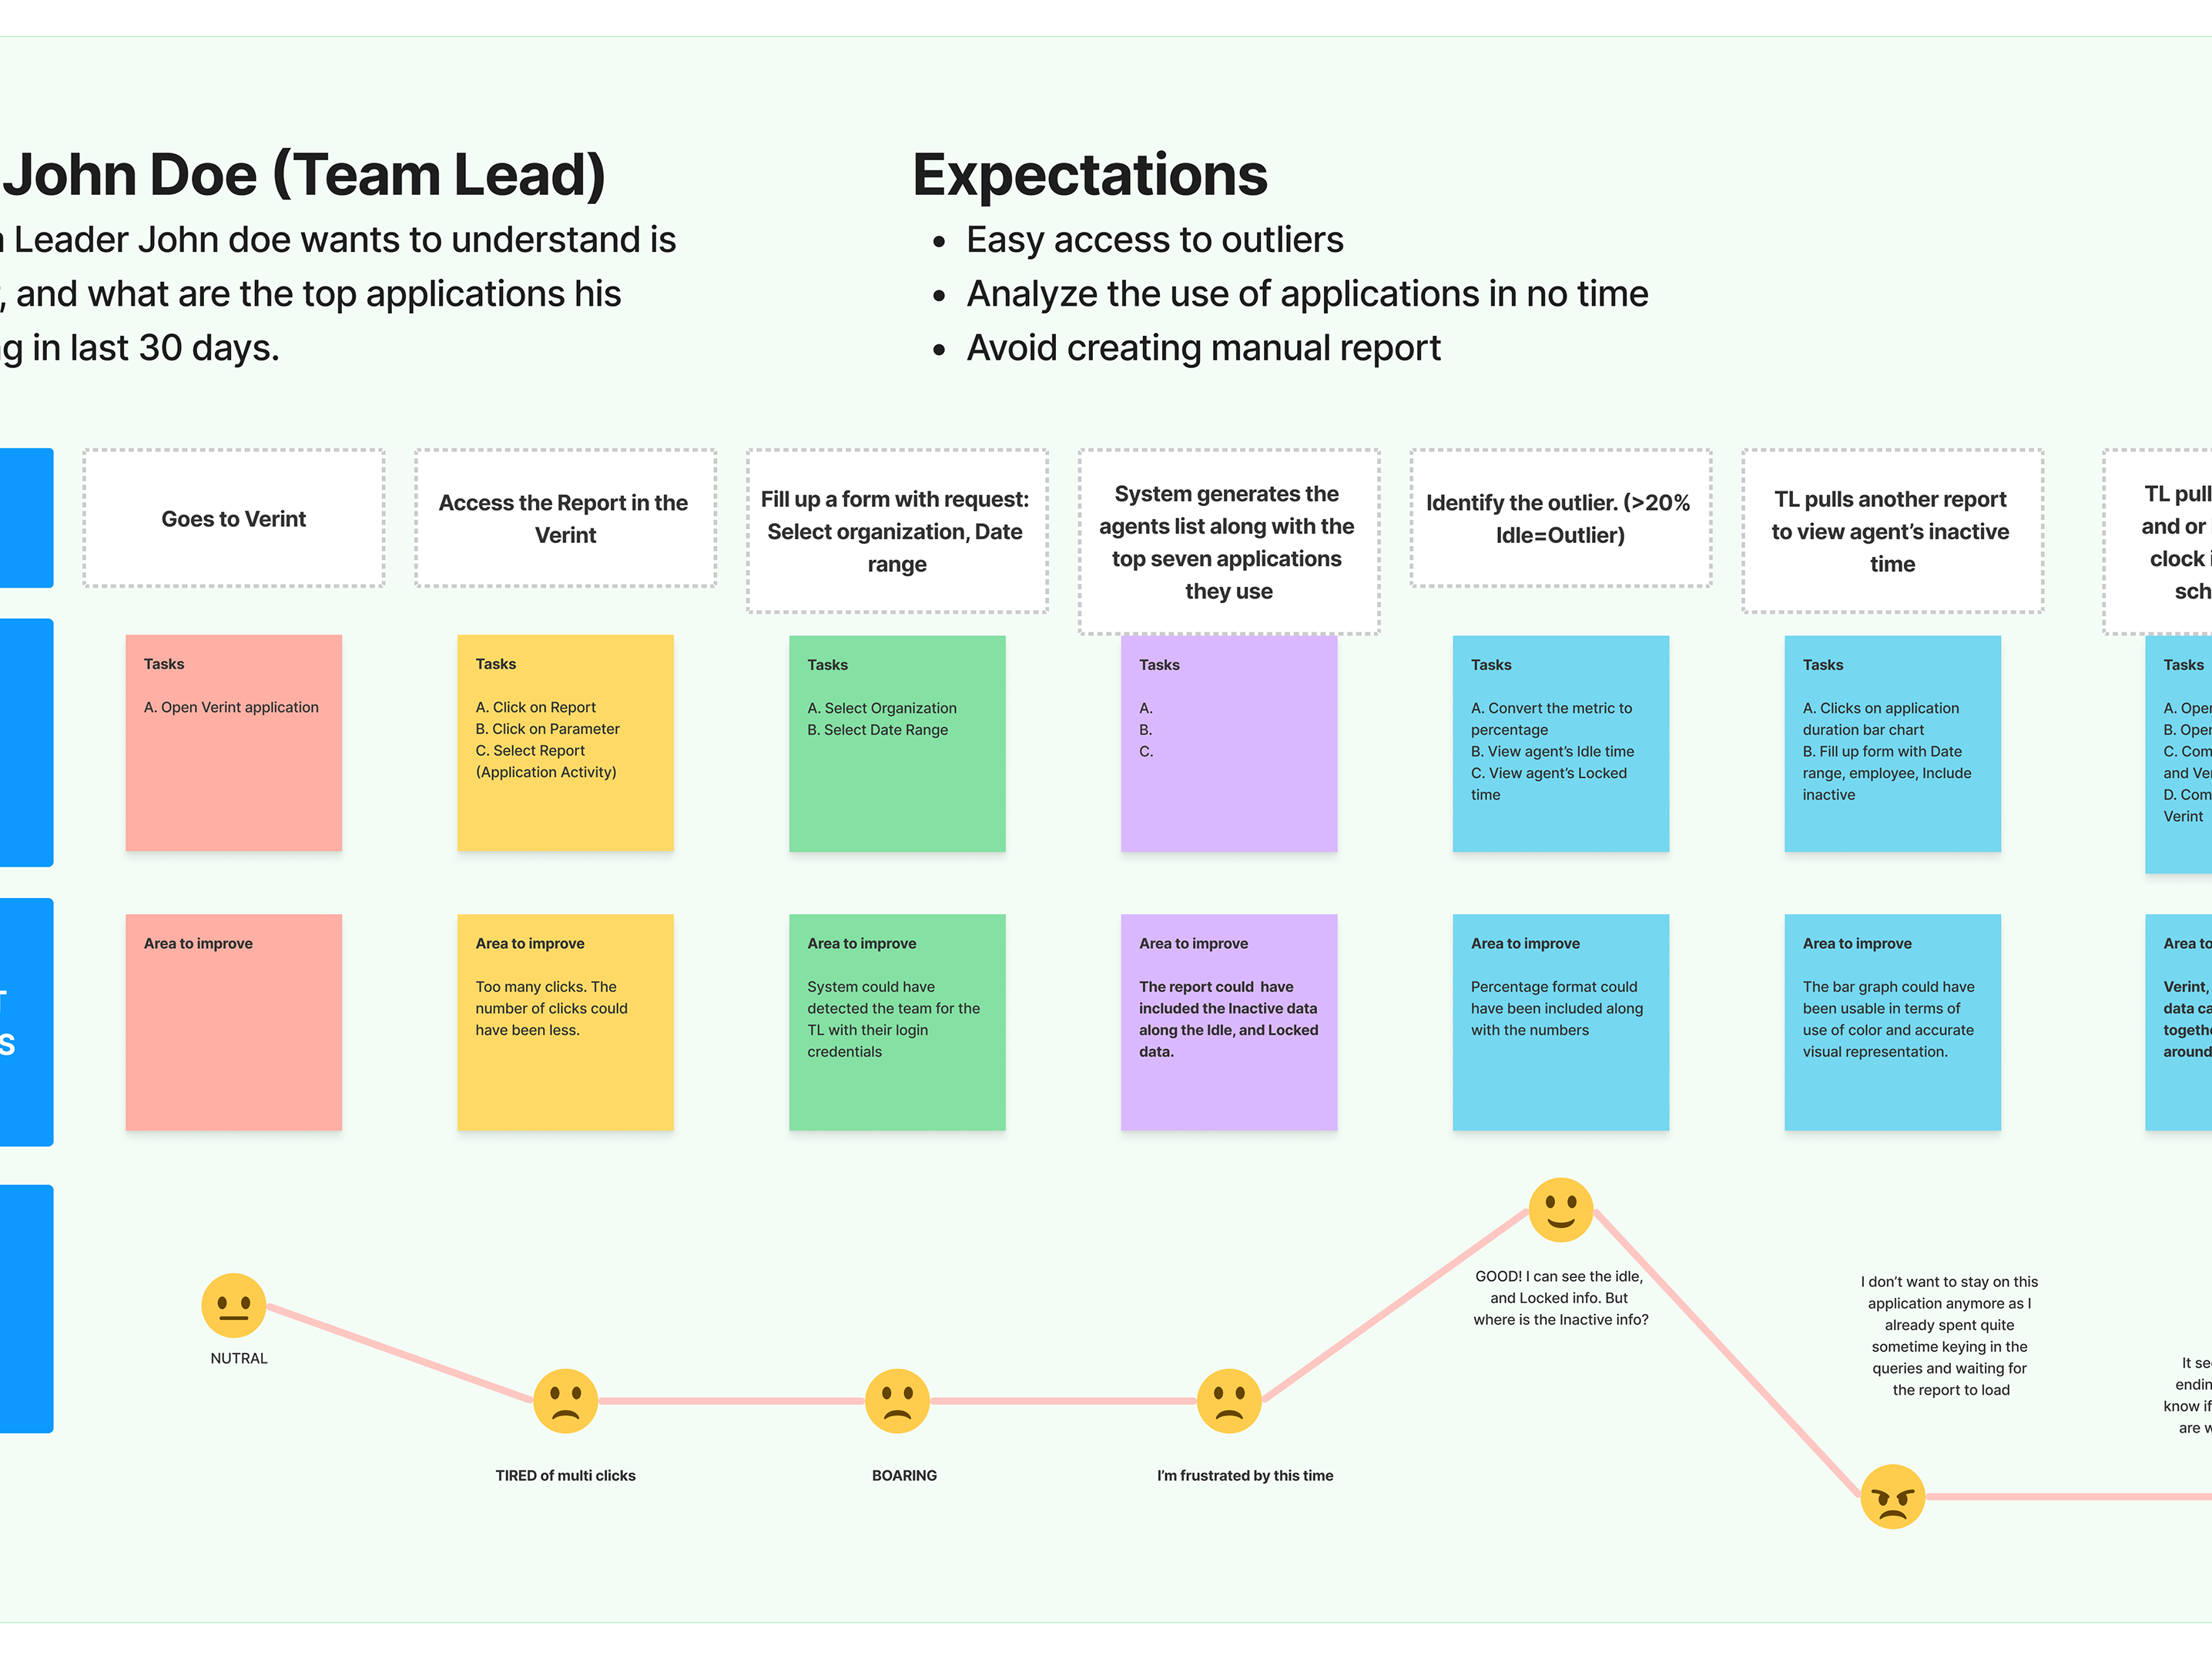
To fully understand how users interact with the drop dashboard and clearly define their pain points, I created a journey map. This helped my team align internally, avoid assumption misalignments, and provided a clear, memorable reference that managers, stakeholders, and staff could easily relate to and digest.
Who are the most important people involved in both the drop dashboard experience: Stakeholder Map
A stakeholder map is a reflection of which stakeholders are involved in this ecosystem, helps to reveal existing relationships between these stakeholders, and identifies informal networks or frictions between stakeholders.
The user research findings were allocated to three major categories to be fixed.
Design Solution
Prototype URL: https://www.figma.com/proto/ZWpeGTSfSnE4PB9mQnFppCXB/


